"MRS Spectroscopy" – monitored by Radiologist
> 1. SV – TE 35(metabolites with both short and long T2 relaxation times are observed)
2. SV – TE 144( inverts lactate at 1.3 ppm.)
{section thickness = 10 mm, TR = 1500 ms, FOV = 24 cm, NEX = 1, and 16 × 16 phase-encoding steps}
3 single-voxels: one over lesion, a second near the edge of the suspicious area, and a third within normal tissue. Voxel placement chosen by Radiologist.
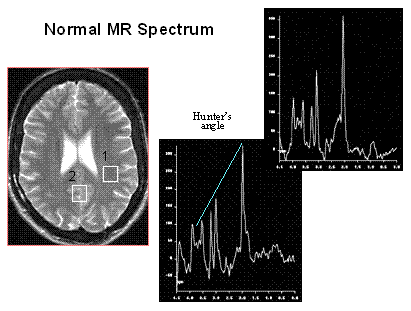
The auto-pre-scan should be repeated two - three times before acquisition so as to optimize the shim; a FWHM ~ 4 - 6 Hz (Lnwdth) following auto-pre-scan indicates good field homogeneity
MR spectroscopy raw data were transferred to a workstation and processed by using the spectroscopy analysis software.
Statistical Analysis of "MRS Spectroscopy"
Statistical analysis was performed by using the Friedman test for related multigroup samples and the Mann-Whitney test for 2-group samples. A P < .05 was considered significant.
Technical notes of "MRS Spectroscopy"
- The MCD were identified and classified on the basis of conventional images of the MR imaging study, and the image that best represented the MCD in the axial T2-weighted sequence was identified. Within this image, a large volume of interest was defined for field homogeneity optimization.
- Water-suppressed multivoxel MR spectroscopy of this volume of interest used in the sequence.
- Fat is avoided by placing the voxel for MRS within the brain, away from the fat in bone marrow and scalp.
- She single voxel, short TE technique is used to make the initial diagnosis, because the signal-to-noise is high and all metabolites are represented.
- Multi-voxel, long TE techniques are used to further characterize different regions of a mass and to assess brain parenchyma around or adjacent to the mas


No comments:
Post a Comment